


Join 5,000+ students who’ve improved with us since 2022.
Quadratic Graphs Made Simple: How to Plot and Understand Them
Have you ever wondered why some graphs curve into a smooth U-shape while others form an upside-down parabola? In Secondary 2 Maths, these curves come from quadratic graphs — a topic that is constantly revisited even in Upper Secondary Math!
For many students, plotting a quadratic curve can feel intimidating at first. This is especially so if you’re used to drawing straight linear graphs. Unlike linear graphs, quadratic graphs change direction and have a turning point, which can make them seem tricky to sketch.
In this chapter, we’ll guide you through the plotting of quadratic graphs from start to finish. Moreover, we’ll provide you with clear examples and practice questions that simulate exam conditions. After this guide, sketching them will feel much less scary and far more manageable!
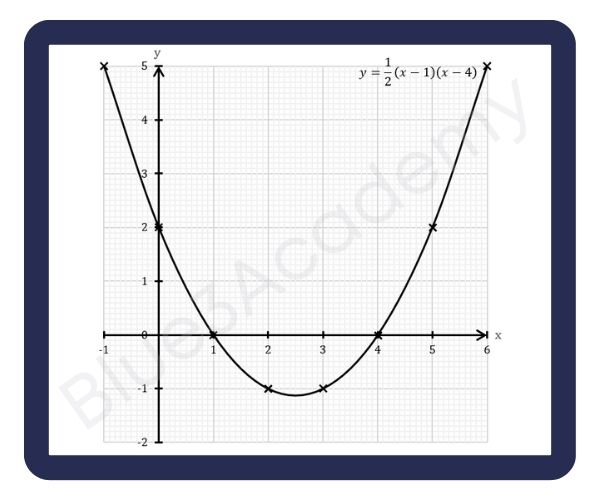
When faced with quadratic equations, one easy way to remember it is by noticing its shape! Given the typical equation of y = ax2 + bx + c, the graph shows up as a smiley face when a > 0. The reverse then happens when a < 0 in the form of a sad face.
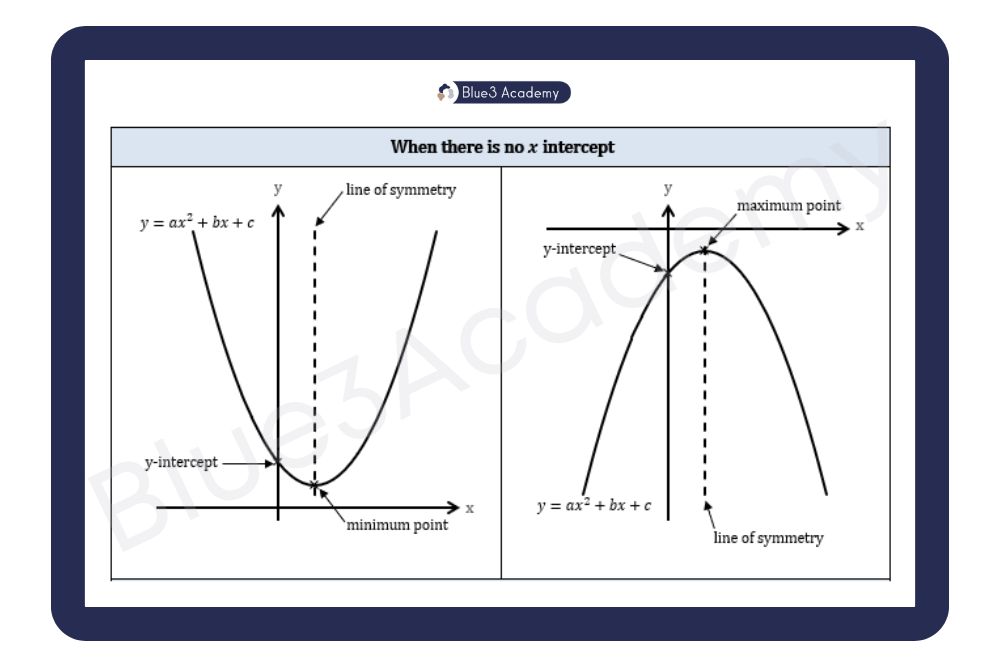
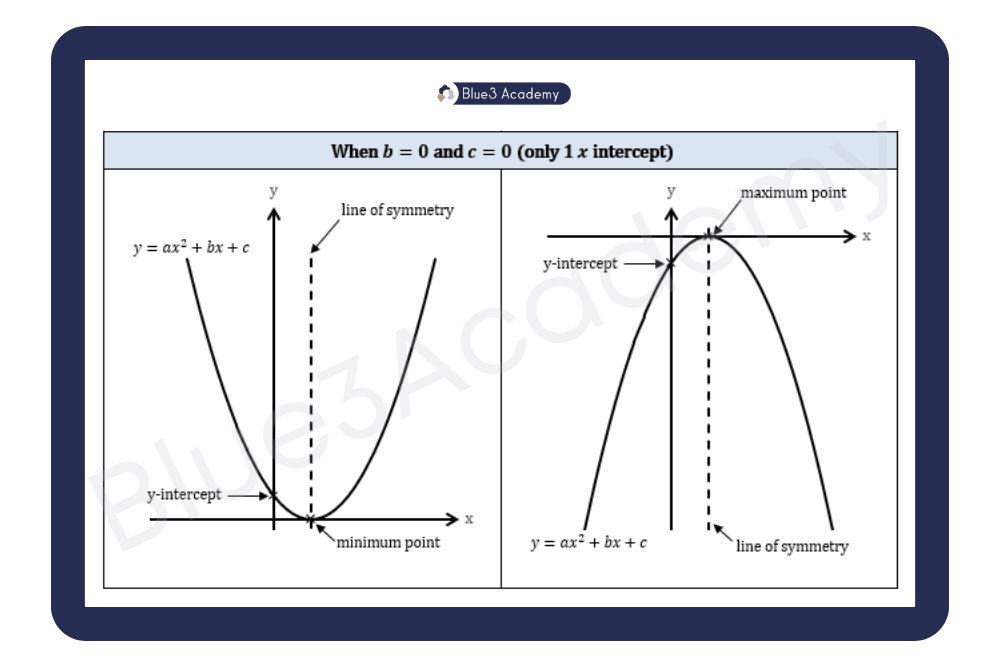
Besides the typical representation of a quadratic graph as per above, here are examples of how other graphs may look in special situations. Examples include: when there is no x-intercept, and when b = 0 and c = 0 (meaning only 1 x-intercept).
By examining the graphs above, we can pick out the main features of a quadratic curve. This includes the y-intercept, x-intercepts, line of symmetry and maximum or minimum point. Knowing these components well will definitely come in handy whenever you need to plot or interpret quadratic graphs!
In this walkthrough, we’ll take a real exam-style question and you’ll see exactly how to plot and identify different components. By following along, you’ll understand how each step connects to the shape of the parabola. Ultimately, you will master how to handle similar questions in your exams with ease.
First, let’s look at these steps on how to plot a quadratic graph:
Next, let’s tackle a sample question with these steps that we’ve learnt!
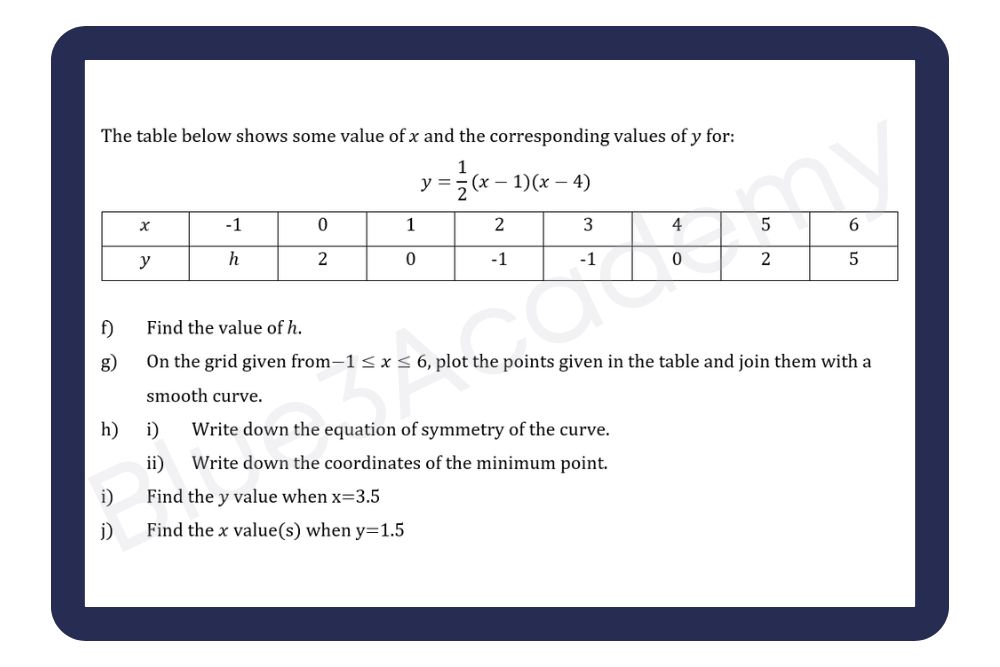
Now that we’ve gone through a detailed example, let’s apply these steps further by working through a practice question! Focus on identifying key points accurately and sketching the quadratic curve neatly – just as you would in a test.
Check your answers here:
f) h = 5
g) Please refer to the curve below
h)i) x = 2
h)ii) (2
i) y = -0.6
j) x = 0.2 or x = 4.8
Quadratic graphs appear regularly in Lower and Upper Secondary Math assessments! Hence, being comfortable with sketching them can make a real difference during the exams. When students know how to identify key features and plot the curve accurately, time taken to process reduces and questions become less stressful to handle.
If you’re looking for more guided practice like this, join us for our Secondary Math Trial Class! In each lesson, we place great emphasis on providing structured support with exam-style questions and clear teacher guidance. Watch just how our experienced teachers and in-house curriculum help students master Math concepts accurately and approach assessments with greater ease.
👉🏻 Looking for more high-quality Math & Science content? Click here to access more free notes & resources!
📹 Do check out our Instagram & TikTok accounts for more academic videos!
Wish to know more about our programs?
Leave your details and let us guide your child towards stronger understanding, real progress, and confident, purposeful learning!
Copyright © 2025 Blue3Academy. All rights reserved.
WhatsApp us